TestGen has built-in tools for importing and managing graphics. The Graphics Library and preferences for graphics positioning are described below.
Graphics you insert into a testbank questions are saved in the Graphics Library so that you can reuse them in other questions. Each testbank and test maintains its own Graphics Library, although the Graphics Library is not accessible from tests.
To open the Graphics Library while editing a testbank question, select "Graphics Library" from the Tools menu. You can also open the Graphics Library by double-clicking any graphic that has previously been inserted in a question.

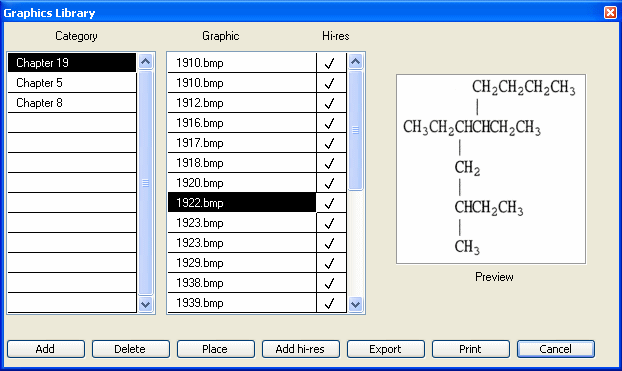
The Graphics Library displays a list of one or more categories, and when you select a category, you see the names of the graphics files that are in the selected category. A Preview window shows a thumbnail view of the selected graphic. Images that are pasted into a question or inserted using the Picture option on the Insert menu are listed in a category named Miscellaneous.
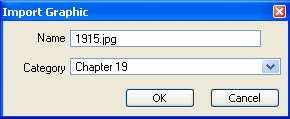
To add new graphics to the Graphics Library after you have opened it, click the Add button. When the file dialog appears, locate the graphic file you want to insert and click OK. The Import Graphic dialog opens, as shown here.

You can save graphics in a Miscellaneous category or use a separate category for each chapter. Use one of the existing category names in the drop-down menu or type a new category name in the space provided. You can also rename a graphic file before you store it in the Graphics Library. Click OK to add the image file to the Graphics Library.
To insert a graphic from the Graphics Library into a question, place the cursor where you want to insert the graphic in the question. Select "Graphics Library" from the Tools menu to open the Graphics Library. Click a category in the left column and click a graphic filename in the right column. Click the Place button to place the graphic in the question and close the Graphics Library window.
Note: If the graphic is the first or only item in a question or answer field, it will align with the base of the question number or what would be the first line of text, which might not be desirable. You might want to insert a return (press Enter) before the graphic to move it down a line in the field and produce a better visual effect.
Images that you insert into tests, testbanks, and the Graphics Library, are generally designed to be displayed on-screen, at 96 dpi for Windows and 72 dpi for Macintosh. Printing images at these resolutions may not produce high-quality results if the images have a lot of detail. To ensure that the printed image will not be fuzzy or blurred, you can attach a higher-resolution image to the lower-resolution on-screen image in the Graphics Library.
Begin by inserting the lower-resolution version into a question or by choosing Add in the Graphics Library. Then, be sure the filename of the low-resolution graphic is selected in the Graphics Library, and click the Add Hi-res button. Find the file that is the high-resolution version of your graphic and open it. A check mark appears in the column labeled "Hi-res" to show that the high-resolution version of the graphic has been included in the Graphics Library. TestGen automatically selects the lower-resolution version to display on the screen and the higher-resolution version to print.
Instructions later in this section give more details about creating low- and high-resolution images.
To replace a graphic in the Graphics Library with a new, updated version of the graphic, open the Graphics Library and choose Add. Locate the new, altered graphic file on your computer. In the Import Graphic dialog, use the same name for the file as the original name and choose the same category as the old graphic to insert the new graphic. Answer "yes" when the program prompts you to replace the existing graphic. The updated graphic replaces the old graphic everywhere the original graphic was used in the testbank or test.
If the revised graphic is a different size than the original, the program remeasures the graphic and updates every question that uses the graphic to make sure the space allowed for the graphic is correct. This step takes only a few seconds. We recommend that you choose "Yes" to re-measure. If you choose not to have the program re-measure the graphic immediately after updating it, the program re-measures each affected question individually the next time it is displayed.
To delete a graphic from the Graphics Library, click once on its name and then click the Delete button. TestGen displays a message if any of the testbank's or test's questions currently use the graphic. If you click OK, the graphic file will be removed from the Graphics Library and from all the questions that use it.
To print any or all of the graphics in the Graphics Library, highlight the category and/or graphic you want to print and click "Print." In the Print Graphics dialog, make your selection and click OK.
You can export a graphic from the Graphics Library to make changes to it using an external graphics editing program. When you select a graphic file in the Graphics Library and click Export, the program prompts you to enter the name and location where you want the file to be saved. The file exports in the same format as it was imported. If an image has a high-resolution version attached to it, both the low- and high-resolution image are exported.
To prepare a graphic file to insert into TestGen, use a commercial software package to create your picture and then save it in one of the accepted graphics formats: bmp, gif, jpg, png, tif, black-and-white pcx, or pict (Mac only).
The screen resolution for displaying graphics is 96 dpi (Windows) or 72 dpi (Macintosh). Depending on the amount of detail in the image and the file format, the printed version of the image could be more "jaggy" or "grainy" than it appears on-screen. In this case you need to prepare a higher-resolution graphic that will print in the same space used by the screen-size graphic.
If you use a vector-based program, such as Adobe Illustrator, you can create the graphic and then export it as a bitmap (.bmp) with a resolution of 96 dpi to match the Windows screen resolution. To prepare a high-resolution version of the same image, export the file again and set the resolution at 150 or 300 dpi. Use a naming scheme, such as fig0301.bmp and fig0301x.bmp, to identify the low- and high-resolution files for the same image.
If you use a raster-based (bitmap) drawing program, such as PaintShop Pro®, create an image that is two or three times the desired on-screen size, and save this version as the high-resolution bitmap. Then scale or resize the graphic to the size you want for the on-screen display, and save this as the low-resolution bitmap. For example, create a graphic that is twice as large as needed, using 18- or 20-point Arial type for text and labels, and save it as the high-resolution bitmap. Reduce the image to 50% for the on-screen, low-resolution image.
Limit the physical measurement of each on-screen image to no more than 5 inches wide and 6 inches high. This is the approximate, maximum size that will fit on a printed page along with a question. Crop images to remove extra white space surrounding the actual image. Remember that having large images in online questions could require the student to scroll up and down in the window to see the full image and to read and answer the question.
When you prepare graphics for TestGen, the size of each graphic file must be less than one megabyte (1 MB = 1000 bytes). If the image is large and the file size is larger than 1 MB, you can break the image into two or more parts to insert into the question in a side-by-side or stacked configuration.
Reducing the number of colors in your graphics to 256 or grayscale usually preserves more than enough detail, while making the file size smaller and reducing the time it takes to download images for online tests. Two-color images (black and white) usually work for simple line art, while 16 or 256 colors usually work well for more detailed images. If possible, process the images to make them web-ready before importing into TestGen. Images using 24-bit color may be too large to import.
During testbank editing, you can insert graphics and function plots as either text characters or transparent objects. Indicate which setting you prefer by selecting "Preferences > Application" from the Tools menu and clicking the Graphics Position tab.
Graphics and function plots inserted as text characters become part of the line of text and move along with the text if characters are inserted or deleted or if the text wraps to the next line. They affect the line spacing by aligning the bottom of the graphic with the baseline of the line of text.
Graphics and function plots inserted as transparent graphics can be placed at a static location and remain in the background so you can type over and around the image to place labels or other information.
When you insert a graphic or function plot as a transparent object, it is automatically placed in the upper-left corner of the field where you inserted it, at coordinates (0,0).
Note: If the graphic or function plot is the only object in the edit field, you may see only the first line of it because only one line of text is visible. Press the [Enter] or [Return] key several times to add more lines to the field and display the rest of the graphic.
To reposition a transparent graphic, first select "Transparent Graphics" from the Tools menu. This displays a list of the graphics and function plots used in the current field. Select an object in the list, click the Position button, and enter new coordinates for the upper-left corner of the graphic.
Tip: The measurements are in pixels, so remember that an inch on-screen is approximately 96 pixels (Windows) or 72 pixels (Macintosh).